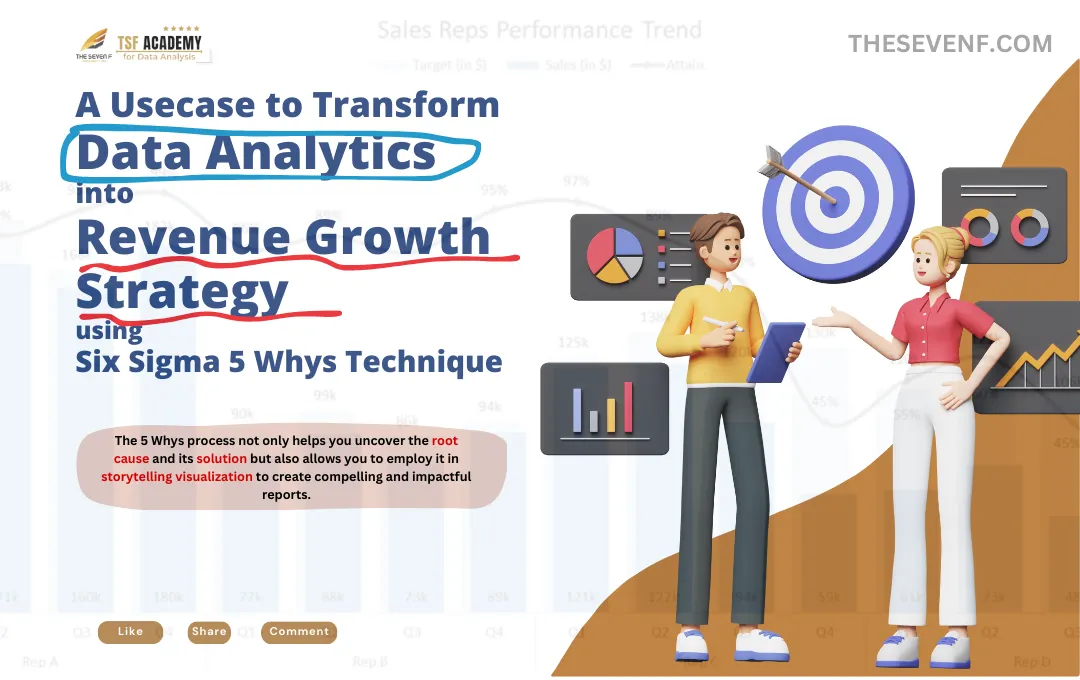
A Usecase to Transform Data Analytics into Revenue Growth Strategy using Six Sigma 5 Whys Technique
How can the 5 Whys technique from Six Sigma help you solve the biggest challenges in your business through Data Analysis – P1?
In this article I will breakdown 3 of the most significant problems in Sales Operations function in SaaS business using the 5 whys technique and using data analysis to answer all my questions to identify the root-cause and come up with recommendation.
I hope you would enjoy this series and take benefit from the learning and implement this in your sales organization.
Problem statement 1: Decreasing Sales Revenue
Problem statement 2: High Churn Rate amount SaaS Customers
Problem statement 3: Inefficient Sales Pipeline Management
I will break down the above three issues and their respective "5 Whys" solutions with a hypothetical dataset and demonstrate how data analytics techniques can provide data-driven answers to each of the "Why" questions:
Problem Statement 1: Decreasing Sales Revenue
Inorder to solve this problem i will be using Six Sigma 5 Why technique. we will identify the root-casue, possible scenarios and solutions and use the framework to visualize the data in a compelling storytelling format which can be used for reporting purposes.
Why 1: Why is our sales revenue decreasing?
STEP#1: Gather the data.
Suppose you have quarterly sales data for the past two years, showing total sales revenue and the number of deals closed.

STEP #2 : Data Analysis
Create a line chart to visualize the trend in total sales revenue over the past two years.
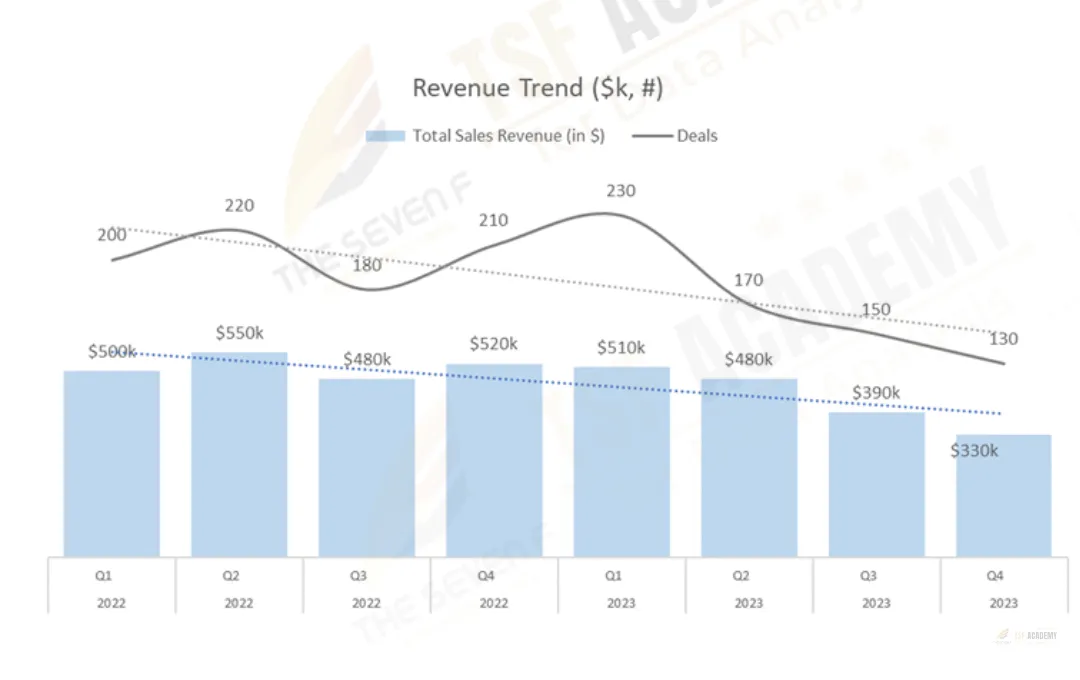
The above chart is clearly telling me that, the number of deals we are closing is much lesser In 2023 compared to 2022.
So Why 1 was, Why is our sales revenue decreasing?
Answer 1: Because our sales team is not closing as many deals as expected.
So my next question in the 5 whys technique would be:
Why 2: Why is the sales team not closing as many deals?
Possible scenarios:
• There are not enough sales target for all the reps. ?
• Some Reps are not able to achieve their targets?
Now, you need to answer these through data analysis.
Data Analysis: Compare individual sales team members' performance against their quarterly sales targets.
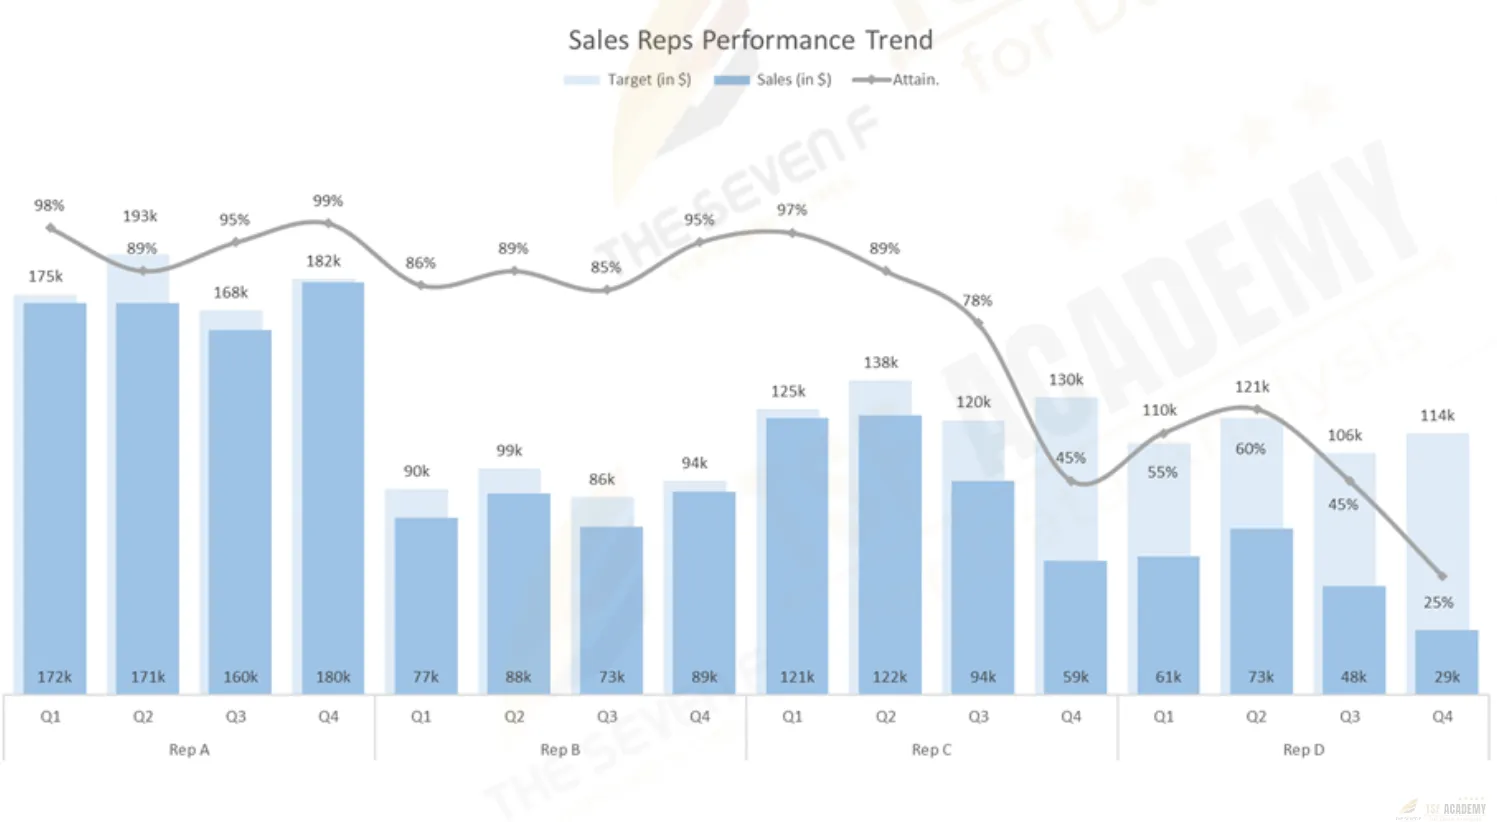
If you look at the above chart, it tells me
Rep D is not meeting his/her target every time starting from 2023Q1 and
Rep C’s performance has been decreasing significantly from 97% in Q1 to 45% in Q4
So to answer the Why 2 i.e. Why is the sales team not closing as many deals?
The Answer 2 is: Because few of the Reps are not meeting their sales targets.
So my next question in the 5 whys technique would be:
Why 3: Why are the sales team members not meeting their sales targets?
Possible scenarios:
- Inadequate training (Rep D)?
- Possible new product introduced from Q3, which Rep C was not trained on?
- Lack of skills on product or sales?
- Lack of motivation or perceived value?
Data Analysis: Analyze training records and sales performance data for correlations.
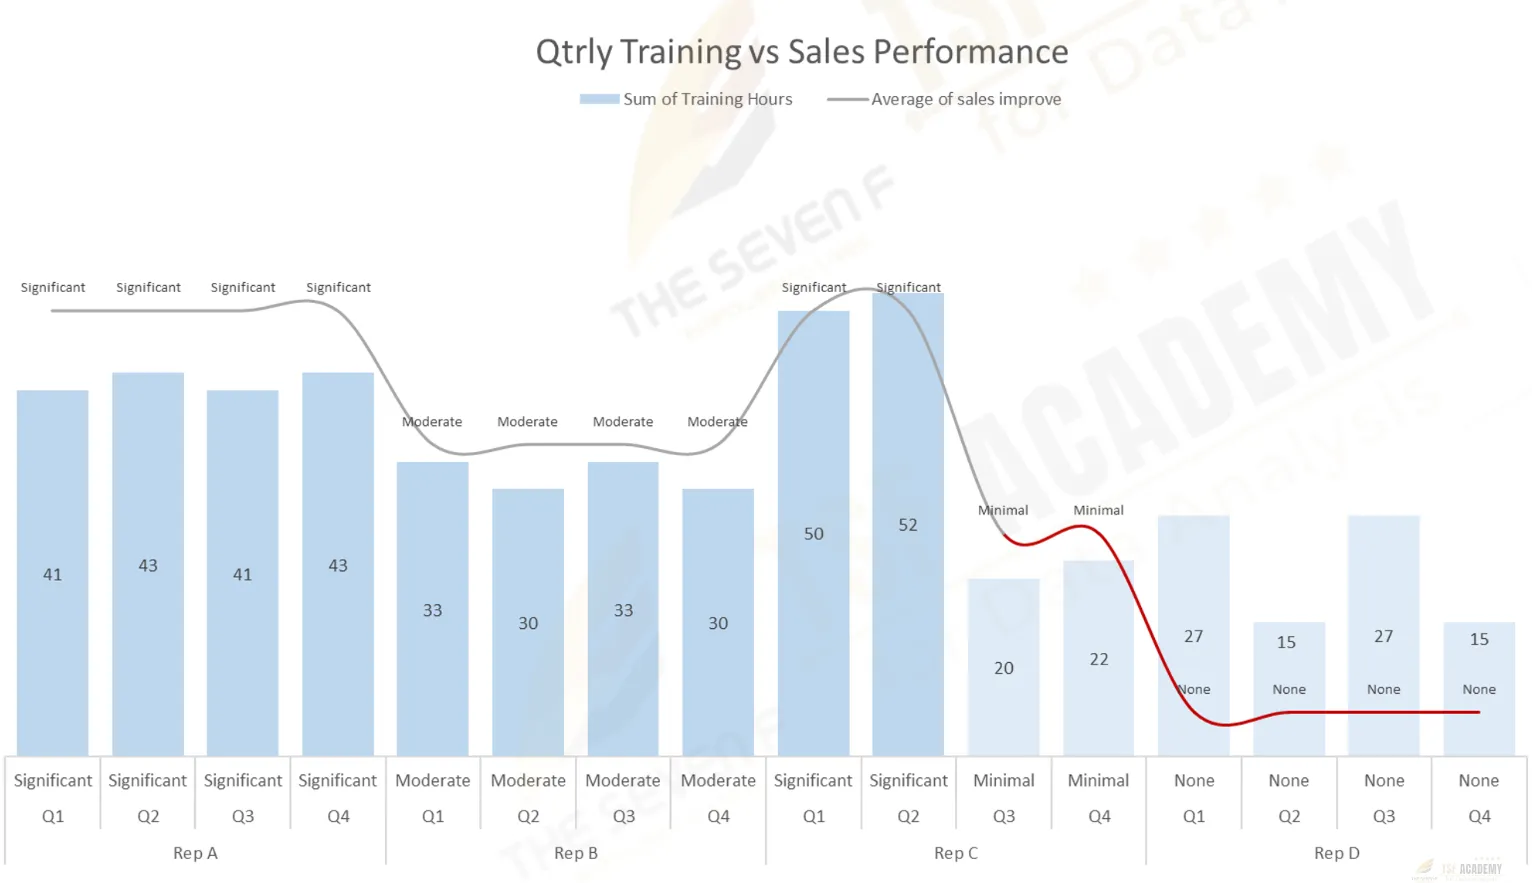
In the above chart I have plotted quarterly training hours from 2023 and the sales performance improvement from significant improvement in sales to none.
You can clearly see in this data there is a strong co-relation between these two.
If you see the red line in the chart,
the training hours is roughly below 25hrs per quarter hence the performance is very low for Rep D for entire 2023 and
for Rep C the performance dropped significantly from 2023 Q3.
So to answer the Why 3 i.e. Why are the sales team members not meeting their sales targets?
Answer 3: Because they don’t invest the time in upgrading their necessary sales skills and product training.
So my next question in the 5 whys technique would be:
Why 4: Why they don’t invest the time in upgrading their necessary sales skills and product training.?
Possible scenarios:
1. Lack of Time Management:
Some sales reps may struggle with time management, finding it challenging to allocate time for training amidst their daily tasks.
Data Analytics:
- Use data to track the daily activities and time allocation of these sales reps.
- analyse their time spent on various tasks and assess whether they are consistently working longer hours or prioritizing other tasks over training.
2. Low Motivation or Perceived Value:
Sales reps may not see the direct link between training and improved performance or may lack motivation to invest time in training
Data Analytics:
- Conduct surveys or collect feedback from sales reps to gauge their perception of training effectiveness and their motivation levels.
- Additionally, analyse the correlation between training hours and sales improvement. If there's a weak correlation, it could suggest a motivation issue.
By collecting and analysing data related to time management and motivation, data analytics can help identify the root causes within these scenarios.
- For instance, if the data reveals that certain sales reps consistently work longer hours, this could indicate a time management issue.
- On the other hand, if feedback and data analysis show a lack of motivation or perceived value, it may indicate the need for improved training content or motivation strategies to make training more appealing and impactful.
Summary:
In this specific scenario,
we have identified that the declining sales revenue can be attributed to the fact that some of the sales representatives lack proper training.
And for this scenario we got the root cause in just 3 Whys.
Further analysis on 4th why as mentioned above will give you the root cause of particular sales rep’s daily activity that you can manage in order to include training time in their daily schedule to improve productivity and efficiency hence resulting into improved sales revenue.
The 5 Whys process not only helps you uncover the root cause and its solution but also allows you to employ it in storytelling visualization to create compelling and impactful reports.
In the next article
I will deep dive into the following problem statements and the root cause through Six Sigma 5 Whys methodology:
Problem statement 2: High Churn Rate amount SaaS Customers
Problem statement 3: Inefficient Sales Pipeline Management
Cheers!