How to Use Sales Analytics to Optimize Your Sales Pipeline
Sales analytics is a critical aspect of any business that wants to optimize its sales pipeline. By analyzing sales data, businesses can make informed decisions that help improve sales performance and increase revenue. In this article, we will explore how to use sales analytics to optimize your sales pipeline and achieve better results.
What is Sales Analytics?
Sales analytics refers to the process of collecting, analyzing, and interpreting sales data to gain insights into the sales process. This data can include sales figures, customer behavior, and other relevant information that can be used to improve sales performance.
The purpose of sales analytics is to help businesses identify areas where they can improve their sales process, identify patterns in customer behavior, and make informed decisions that improve sales performance.
6 Critical Steps on How To Use Sales Analytics to Optimize Your Sales Pipeline?
1. Define Your Sales Goals
The first step in using sales analytics to optimize your sales pipeline is to define your sales goals. What do you want to achieve with your sales process? Is it to increase revenue, improve customer retention, or reduce customer churn? Once you have defined your goals, you can start to collect data that will help you achieve them.
2. Collect Relevant Sales Data
To use sales analytics effectively, you need to collect relevant sales data. This data can come from various sources, including your CRM system, sales reports, customer feedback, and sales team feedback. It's important to collect as much data as possible to get a comprehensive view of your sales process.
3. Analyze Your Sales Data
Once you have collected your sales data, the next step is to analyze it. Sales analytics tools can help you analyze your data and identify trends, patterns, and insights that can help you optimize your sales pipeline. For example, you can analyze your sales data to identify the most profitable products, the most successful sales channels, or the most effective sales techniques.
4. Use Sales Metrics(KPIs) to Monitor Performance
Sales metrics are key performance indicators that can help you monitor the performance of your sales pipeline. By monitoring your sales metrics, you can identify areas where your sales process needs improvement and make data-driven decisions to optimize your sales pipeline. Some of the key sales metrics include sales conversion rates, sales cycle length, customer lifetime value, and customer acquisition cost.
5. Use Sales Forecasting to Plan Ahead
Sales forecasting is the process of predicting future sales based on historical data and trends. By using sales forecasting, you can plan ahead and anticipate changes in your sales pipeline. This can help you make informed decisions about your sales strategy, adjust your sales targets, and allocate resources more effectively.
6. Identify Sales Trends
Sales trends analysis involves identifying patterns and trends in your sales data. By identifying sales trends, you can make data-driven decisions about your sales strategy and optimize your sales pipeline accordingly. For example, if you notice a decline in sales for a particular product, you can adjust your sales strategy to address the issue.
STEP #1: How to define your sales goals?
Defining your sales goals is an important first step in using sales analytics to optimize your sales pipeline. Sales goals are specific targets that you set for your sales team to achieve within a certain timeframe. These goals should be aligned with your overall business objectives and should be measurable so that you can track progress and measure success.
There are several types of sales goals that you can set, depending on your business objectives. Some common sales goals include:
- Revenue targets: These goals focus on generating revenue for your business. Revenue targets can be set for a specific product or service, or for the business as a whole.
- Customer acquisition goals: These goals focus on acquiring new customers. This can include increasing the number of leads generated, improving conversion rates, or targeting specific customer segments.
- Customer retention goals: These goals focus on retaining existing customers. This can include reducing customer churn, increasing customer satisfaction, or improving customer loyalty.
- Sales efficiency goals: These goals focus on improving the efficiency of your sales process. This can include reducing the length of the sales cycle, improving the accuracy of sales forecasts, or increasing the productivity of your sales team.
When defining your sales goals, it's important to ensure that they are SMART goals. This means that they should be specific, measurable, achievable, relevant, and time bound.
For example, a SMART sales goal could be to increase revenue by 10% within the next quarter by targeting a specific customer segment and improving conversion rates.
Once you have defined your sales goals, you can start to collect data and use sales analytics tools to monitor progress and make data-driven decisions to optimize your sales pipeline. By regularly reviewing your sales goals and adjusting your strategy as needed, you can improve your sales performance and achieve better results.
STEP #2 : How to collect relevant sales data:
Collecting relevant sales data is critical for using sales analytics to optimize your sales pipeline. Here are some tools you can use to collect sales data:
Customer Relationship Management (CRM) Software:
CRM software allows you to collect customer data, track sales leads, and monitor customer behavior. To collect relevant data, you should customize your CRM software to include fields that are relevant to your sales goals.
For example, if your goal is to increase customer retention, you may want to track customer satisfaction scores or customer churn rates. Most CRM software also integrates with other sales tools, such as email marketing software or social media platforms, so you can collect data from multiple sources.
This software can be used to collect and store customer data, track sales leads, and monitor customer behavior. There are many CRM software options available, both free and paid, including:
· HubSpot CRM (Free): https://www.hubspot.com/products/crm
· Zoho CRM (Free and Paid Options): https://www.zoho.com/crm/
· Salesforce (Paid): https://www.salesforce.com/products/sales-cloud/overview/
Sales Reporting Tools:
Sales reporting tools allow you to analyze your sales data in a way that is easy to understand. To collect relevant data, you should customize your reports to focus on the metrics that are most important to your sales goals.
For example, if your goal is to increase revenue, you may want to track sales by product or sales by customer segment. Most sales reporting tools allow you to create custom reports, so you can focus on the metrics that matter most to your business.
These tools can help you identify trends and patterns in your sales data and make data-driven decisions to optimize your sales pipeline. Some popular sales reporting tools include:
· Google Analytics (Free): https://analytics.google.com/
· Tableau (Paid): https://www.tableau.com/products/desktop
· Power BI (Free and Paid Options): https://powerbi.microsoft.com/en-us/
Sales Call Recording and Analytics Software:
Call recording and analytics software can help you collect data on your sales calls, including call duration, call frequency, and call outcomes. To collect relevant data, you should set up your call recording and analytics software to capture the metrics that are most important to your sales goals.
For example, if your goal is to improve sales team performance, you may want to track the number of successful sales calls per sales rep or the length of time it takes for a sales rep to close a sale.
Most call recording and analytics software also allows you to analyze call data in real-time, so you can provide immediate feedback and coaching to your sales team.
This data can be used to identify areas where your sales team may need additional training or support. Some popular call recording and analytics software options include:
· CallRail (Paid): https://www.callrail.com/
· Gong (Paid): https://www.gong.io/
· Chorus.ai (Paid): https://www.chorus.ai/
Social Media Analytics Tools:
Social media analytics tools can help you collect data on your social media activity, including engagement rates, click-through rates, and social media follower growth. To collect relevant data, you should focus on the metrics that are most important to your social media strategy.
For example, if your goal is to increase social media engagement, you may want to track the number of likes, shares, and comments on your social media posts.
Most social media analytics tools also allow you to schedule social media posts and monitor social media activity in real-time, so you can respond to customer inquiries and feedback quickly and efficiently.
This data can be used to identify which social media platforms are most effective for your business and to develop a social media strategy that aligns with your sales goals.
Some popular social media analytics tools include:
- Hootsuite Insights (Paid): https://hootsuite.com/products/insights
- Sprout Social (Paid): https://sproutsocial.com/
- Google Analytics Social Reports (Free): https://support.google.com/analytics/answer/6205762
businesses should customize their sales tools to focus on the metrics that are most important to their sales goals. By using these tools to collect and analyze sales data, businesses can optimize their sales pipeline and achieve better results.
STEP #3: 15 Ways on How to analyze your sales data?
Analyzing your sales data is critical for optimizing your sales pipeline and achieving better results. By using sales analytics to identify patterns and trends in your sales data, you can make data-driven decisions that improve your sales performance. Here are some tips for analyzing your sales data:
1. Identify Key Metrics:
To begin analyzing your sales data, you need to identify the key metrics that are most important to your sales goals. These metrics will vary depending on your business, but may include sales volume, sales conversion rates, average deal size, customer acquisition costs, and customer lifetime value. Once you have identified your key metrics, you can start collecting data and tracking changes over time.
2. Use Data Visualization Tools:
Data visualization tools, such as charts and graphs, can help you visualize your sales data and identify trends and patterns. By using these tools, you can quickly spot areas where your sales performance is improving or declining. Some popular data visualization tools include Tableau, Power BI, and Google Analytics.
3. Conduct Cohort Analysis:
Cohort analysis allows you to group your customers based on a shared characteristic, such as the month they made their first purchase or their geographic location. By analyzing customer behavior within these cohorts, you can identify trends and patterns that may not be visible when looking at your sales data as a whole. For example, you may find that customers who make their first purchase in December are more likely to become repeat customers than those who make their first purchase in June.
4. Use A/B Testing:
A/B testing allows you to test different sales strategies and identify which approach is most effective. By testing different sales messaging, pricing, or product features, you can identify the best approach to use with your target audience. A/B testing can be conducted using sales reporting tools or email marketing software, among other tools.
5. Monitor Sales Funnel Metrics:
Sales funnel metrics, such as lead generation, lead conversion rates, and deal closing rates, can help you identify areas of your sales process that may need improvement. By monitoring these metrics, you can identify bottlenecks in your sales process and make changes that improve your sales performance. For example, you may find that your lead generation strategies are not effective, leading to a low number of qualified leads. By adjusting your lead generation strategies, you can improve the quality of your leads and increase your sales conversion rates.
6. Use Predictive Analytics:
Predictive analytics uses machine learning algorithms to analyze historical sales data and identify patterns that can be used to predict future sales. By using predictive analytics, you can identify potential sales opportunities and forecast future sales performance.
7. Analyze Customer Feedback:
Customer feedback can provide valuable insights into customer needs, preferences, and pain points. By analyzing customer feedback, you can identify areas where your sales process can be improved, as well as opportunities for new product development or sales strategies.
8. Conduct Competitive Analysis:
Competitive analysis allows you to compare your sales performance against that of your competitors. By analyzing competitors' sales data and strategies, you can identify areas where you can improve your sales process and gain a competitive advantage.
9. Use Sales Forecasting:
Sales forecasting allows you to predict future sales performance based on historical sales data, market trends, and other factors. By using sales forecasting, you can identify potential sales opportunities, allocate resources more effectively, and improve your sales pipeline management.
10. Segment Your Data:
Segmenting your sales data allows you to analyze sales performance by customer segment, product category, sales channel, and other factors. By analyzing sales performance within each segment, you can identify areas where you can improve sales performance and tailor your sales strategies to specific customer groups.
11. Conduct Profitability Analysis:
Profitability analysis allows you to analyze sales performance based on profitability metrics, such as gross profit margin, net profit margin, and return on investment. By conducting profitability analysis, you can identify areas where your sales process can be improved to increase profitability.
12. Use Text Analytics:
Text analytics allows you to analyze unstructured data, such as customer reviews and social media posts, to identify customer sentiment and feedback. By using text analytics, you can identify areas where your sales process can be improved to better meet customer needs and preferences.
13. Conduct Sales Rep Performance Analysis:
Sales rep performance analysis allows you to analyze sales performance by individual sales reps. By identifying top-performing sales reps and areas where other reps can improve, you can optimize your sales team's performance and increase sales revenue.
14. Use Geographic Analysis:
Geographic analysis allows you to analyze sales performance by region, city, or other geographic factors. By identifying areas with high or low sales performance, you can adjust your sales strategies and allocate resources more effectively.
15. Monitor Customer Lifetime Value:
Customer lifetime value is a metric that measures the total revenue that a customer is expected to generate over their lifetime. By monitoring customer lifetime value, you can identify high-value customers and tailor your sales strategies to maximize their value to your business.
Here are some insights and statistics that highlight the importance of analyzing your sales data:
- Companies that use sales analytics are 5 times more likely to make faster decisions than their competitors (Source: Forbes).
- Companies that use sales analytics see a 10% increase in revenue within 2 years (Source: Harvard Business Review).
- Sales teams that use data visualization tools are 28% more likely to meet their sales targets than those that do not (Source: HubSpot).
- Companies that use A/B testing see an average conversion rate increase of 49% (Source: Adobe).
- Sales teams that monitor their sales funnel metrics see a 17% increase in sales revenue compared to those that do not (Source: Pipedrive).
STEP #4: Use 15 Powerful Sales Metrics to Monitor Performance
1. Sales revenue: the total amount of money generated by sales.
Sales revenue is a financial metric that represents the total amount of revenue generated from the sale of goods or services during a specific period of time. It is an important metric for businesses to track as it reflects the success of their sales efforts and can provide valuable insights into the overall financial health of the company.
Sales revenue is typically reported on a company's income statement and is calculated by multiplying the number of units sold by the selling price per unit. It is an important metric for businesses because it directly impacts their profitability. The more revenue a business generates, the more it can invest in its operations, marketing, and research and development, which can ultimately lead to growth and expansion.
In addition, sales revenue can provide insights into customer behavior, product performance, and market trends. By analyzing sales revenue data, businesses can identify:
- which products or services are most profitable,
- which customer segments are most valuable,
- and which marketing channels are most effective.
ales revenue is a critical metric for businesses to track as it provides a clear indication of their financial performance and can inform strategic decision-making.
To calculate sales revenue, you need to multiply the number of units sold by the selling price per unit. The formula for sales revenue is:
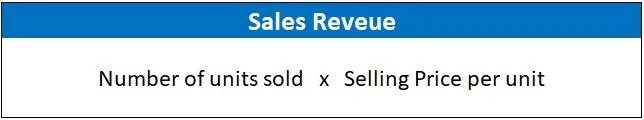
For example, if you sold 1,000 units of a product at a selling price of $10 per unit, the calculation would be:
Sales revenue = 1,000 units x $10 per unit = $10,000
So the sales revenue generated from the sale of 1,000 units at a price of $10 per unit would be $10,000.
2. Sales growth rate: the rate at which sales are growing or declining over a period of time.
Sales growth rate is a financial metric that measures the rate at which a company's sales revenue is increasing or decreasing over a specific period of time. It is an important metric for businesses to track as it indicates whether their sales efforts are effective in generating revenue and driving growth.
A positive sales growth rate means that the company is growing and expanding, which is a good indicator of its financial health. It shows that the company is increasing its market share, attracting new customers, and selling more products or services. On the other hand, a negative sales growth rate means that the company's sales revenue is decreasing, which can indicate a decline in the company's financial health.
Sales growth rate can be calculated over various time periods, such as monthly, quarterly, or annually. It is also essential to compare sales growth rate to industry benchmarks and competitors to determine how the company is performing in the market.
Tracking sales growth rate over time can provide valuable insights into the success of the company's sales strategies and help to identify areas for improvement. For example, if a company's sales growth rate is declining, it may indicate that its products or services are not meeting customer needs, or that its marketing and sales efforts are not effective. In this case, the company may need to make changes to its product offerings or sales tactics to increase sales revenue and drive growth.
Overall, sales growth rate is an important metric for businesses to monitor as it provides a clear indication of their financial performance and can help to inform strategic decision-making.
To calculate sales growth rate, you need to compare the sales revenue for two different periods of time and calculate the percentage change. The formula for sales growth rate is:
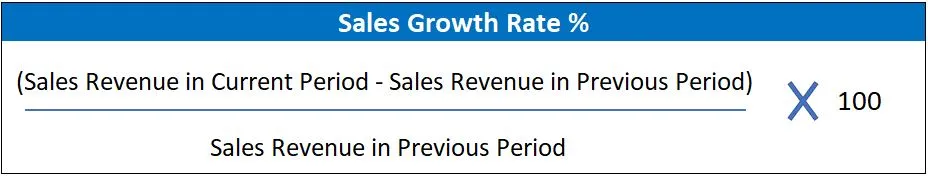
For example, if a company had sales revenue of $100,000 in the previous period and sales revenue of $120,000 in the current period, the calculation would be:
Sales Growth Rate = (($120,000 - $100,000) / $100,000) x 100% = 20%
So the sales growth rate for the current period is 20%. This means that the company's sales revenue has increased by 20% compared to the previous period.
It's important to note that when calculating sales growth rate, it's essential to use comparable time periods. For instance, comparing sales revenue from the first quarter of one year to the second quarter of another year will not provide an accurate sales growth rate as there are seasonal fluctuations and external factors that can affect sales.
Sales growth rate is an important metric for businesses to track as it helps to evaluate the performance of the company's sales efforts over time. A positive sales growth rate indicates that the company is growing and expanding, while a negative growth rate suggests that the company's sales revenue is decreasing, which can be a cause for concern.
3. Conversion rate: the percentage of leads that convert into paying customers.
Conversion rate is a marketing metric that measures the percentage of website visitors who complete a desired action, such as making a purchase, filling out a form, or subscribing to a newsletter.
It is an important metric for businesses to track as it helps to evaluate the effectiveness of their website and marketing efforts.
A high conversion rate indicates that a business is effectively communicating the value of its product or service to its target audience and persuading them to take the desired action. This can result in increased sales, leads, or subscribers, which can ultimately drive growth and revenue.
On the other hand, a low conversion rate may indicate that a business needs to make changes to its website design, user experience, or marketing tactics to better engage its target audience and improve the likelihood of conversion.
By tracking conversion rate, businesses can identify areas for improvement in their marketing and sales efforts and make data-driven decisions to increase conversions and drive growth. It can also help businesses to identify which marketing channels or campaigns are most effective in driving conversions and allocate their resources accordingly.
Overall, conversion rate is an important metric for businesses to monitor as it provides valuable insights into the effectiveness of their website and marketing efforts and can help to inform strategic decision-making.
To calculate the conversion rate, you need to divide the number of conversions by the number of website visitors and multiply by 100%.
The formula for conversion rate is:
For example, if a website had 10,000 visitors in a month and 500 of them completed a desired action, the calculation would be:
Conversion Rate = (500 / 10,000) x 100% = 5%
So the conversion rate for the website is 5%. This means that for every 100 website visitors, 5 of them completed the desired action.
By tracking conversion rate, businesses can identify areas for improvement in their marketing and sales efforts and make data-driven decisions to increase conversions and drive growth. It can also help businesses to identify which marketing channels or campaigns are most effective in driving conversions and allocate their resources accordingly.
conversion rate is an important metric for businesses to monitor as it provides valuable insights into the effectiveness of their website and marketing efforts and can help to inform strategic decision-making
4. Average deal size: the average value of a closed deal.
Average deal size is a sales metric that measures the average value of a company's sales deals.
It is an important metric for businesses to track as it provides insights into the size and value of their sales deals.
A high average deal size indicates that a company is closing larger deals, which can result in increased revenue and profitability. It may also indicate that the company is effectively targeting higher-value customers or offering higher-priced products or services.
On the other hand, a low average deal size may indicate that the company is struggling to close larger deals and may need to focus on improving its sales tactics or targeting higher-value customers.
To calculate the average deal size, you need to divide the total sales revenue by the number of deals closed.
The formula for calculating average deal size is:
For example, if a company had total sales revenue of $100,000 and closed 50 deals in a given time period, the calculation would be:
Average Deal Size = $100,000 / 50 = $2,000
So the average deal size for the company is $2,000. This means that the average value of a single sales deal is $2,000.
By tracking average deal size, businesses can identify trends in the size and value of their sales deals and make data-driven decisions to optimize their sales strategy and drive growth.
For example, if a company's average deal size is declining, it may need to adjust its pricing or sales approach to target larger deals and increase revenue. Alternatively, if a company's average deal size is increasing, it may indicate that the company is successfully expanding its customer base or offering higher-value products or services.
Overall, average deal size is an important metric for businesses to monitor as it provides valuable insights into the size and value of their sales deals and can help to inform strategic decision-making.
5. Sales velocity: the speed at which a sales team is closing deals.
Sales velocity is a sales metric that measures the speed at which a company's deals are closing. It takes into account the average deal size, the length of the sales cycle, and the number of deals in progress. The formula for calculating sales velocity is:
Let's say a company has 30 deals in progress, an average deal size of $5,000, and a sales cycle length of 60 days.
Sales Velocity = (30 x $5,000) / 60 = $2,500
So the sales velocity for this company is $2,500, which means they are generating $2,500 in revenue per day from their deals in progress.
Sales velocity is an important metric for businesses to track as it provides insights into the effectiveness of their sales process and the efficiency of their sales team.
A high sales velocity indicates that the company is closing deals quickly and generating revenue at a fast pace. This can result in increased revenue and profitability. On the other hand, a low sales velocity may indicate that the company is struggling to close deals and may need to improve its sales process or tactics.
By tracking sales velocity, businesses can identify areas for improvement in their sales process and make data-driven decisions to optimize their sales strategy and drive growth.
For example, if a company's sales velocity is declining, it may need to focus on improving its sales cycle length or increasing the number of deals in progress to increase revenue. Alternatively, if a company's sales velocity is increasing, it may indicate that the company is successfully streamlining its sales process or improving its sales team's efficiency.
Sales velocity is also useful for forecasting revenue and setting sales targets. By tracking sales velocity over time, businesses can gain insights into how their sales process is evolving and make data-driven decisions about how to optimize their sales strategy to achieve their revenue goals.
6. Sales cycle length: the amount of time it takes to close a deal.
Sales cycle length refers to the amount of time it takes for a lead to move through the entire sales process and convert into a paying customer. The length of the sales cycle can vary greatly depending on a number of factors such as industry, product complexity, and target audience.
To calculate the length of a sales cycle, you need to track the time it takes for a lead to move through each stage of the sales process, from initial contact to close of sale. The stages in a typical sales cycle may include:
- Prospecting: This is the stage where you identify potential customers and start building a relationship with them. This can involve activities such as cold-calling, email marketing, or attending events.
- Qualification: In this stage, you determine whether a lead is a good fit for your product or service based on factors such as their budget, needs, and decision-making authority.
- Needs Analysis: At this stage, you gather information about the lead's specific needs and how your product or service can help solve their problems.
- Presentation: Here, you present your product or service to the lead and demonstrate how it can meet their needs.
- Proposal: This is where you provide the lead with a detailed proposal outlining the cost, features, and benefits of your product or service.
- Closing: In this final stage, you negotiate terms and finalize the sale.
To calculate the length of the sales cycle, you need to track the time it takes for a lead to move through each of these stages.
For example, if it takes an average of two weeks to move a lead from the prospecting stage to the qualification stage, and another three weeks to move from qualification to needs analysis, and so on, you can add up these times to get the total length of the sales cycle.
By tracking the length of the sales cycle, you can identify areas where the process may be slowed down or where potential bottlenecks may be occurring and take steps to streamline the process and improve efficiency. This can ultimately help you close more deals in less time and increase your overall sales revenue.
7. Lead response time: the time it takes for a sales team to respond to a new lead.
Lead response time is a metric that measures how quickly a sales representative responds to a lead's inquiry or expression of interest. It is an important metric because the faster a sales representative responds to a lead, the greater the chances of converting that lead into a customer.
Studies have shown that the likelihood of converting a lead into a customer decreases significantly as the lead response time increases. For example, a lead that is responded to within 5 minutes is much more likely to convert than a lead that is responded to after an hour or more.
The importance of lead response time can be attributed to several factors, including:
Competition: In today's fast-paced business world, leads have many options to choose from. If a sales representative takes too long to respond to a lead, they may lose out to a competitor who responds more quickly.
Customer experience: A quick response time can improve the overall customer experience by showing that the company values the lead's time and provides excellent customer service.
Sales pipeline efficiency: Faster response times can lead to a more efficient sales pipeline, as leads are moved through the sales process more quickly and effectively.
To calculate lead response time, you need to track the time between when a lead contacts you and when a sales representative responds. The calculation can be broken down into the following steps:
- Record the time the lead contacts you: This could be through a contact form on your website, an email, phone call, or other method of communication.
- Record the time the sales representative responds: This could be through an email, phone call, text message, or other method of communication.
- Subtract the time the lead contacted you from the time the sales representative responded: This will give you the lead response time.
For example, if a lead contacted you at 10:00 AM and a sales representative responded at 10:30 AM, the lead response time would be 30 minutes.
By tracking lead response time, you can identify areas where response times are slow and take steps to improve them. This can ultimately lead to more successful conversions and increased sales revenue.
It's important to aim for a lead response time of less than 5 minutes,
as studies have shown that the likelihood of converting a lead decrease dramatically after that time frame. To optimize lead response time, companies can implement strategies such as automation, lead prioritization, and sales training.
8. Pipeline coverage: the amount of potential deals in a sales pipeline.
Pipeline coverage is a metric that helps sales teams understand the health of their sales pipeline and whether they have enough opportunities in the pipeline to meet their revenue targets. The pipeline coverage formula is:
This formula calculates the percentage of the sales target that is covered by the current value of the sales pipeline. Here's a breakdown of each element of the formula:
- Pipeline Value: This is the total value of all opportunities in the sales pipeline. It includes all deals that are in progress, as well as deals that are likely to close in the future.
- Sales Target: This is the revenue target set for a specific period, such as a month or a quarter.
- 100: This is a multiplier to convert the result into a percentage.
For example, if the sales target for a quarter is $1,000,000 and the total value of the sales pipeline is $500,000, the pipeline coverage would be:
Pipeline Coverage = ($500,000 / $1,000,000) x 100 = 50%
This means that the current pipeline covers 50% of the sales target. A pipeline coverage of less than 100% indicates that the sales team needs to generate more opportunities to meet their revenue target. On the other hand, a pipeline coverage of more than 100% indicates that the sales team has a healthy pipeline with more opportunities than required to meet their target.
Overall, the pipeline coverage formula can help sales teams stay on top of their sales targets, monitor the health of their sales pipeline, and make adjustments to their sales strategies as needed.
you may now ask, what is the typical pipeline coverage % for my industry?
Well, there is no one-size-fits-all answer to what the typical pipeline coverage percentage per industry is, as it can vary based on several factors, including the industry, company size, target audience, and product or service type. However, it is generally accepted that a pipeline coverage percentage of 3x to 5x the sales target is a good benchmark to aim for.
Different industries have different sales cycles and deal sizes, which can affect the pipeline coverage percentage. For example, industries with longer sales cycles and larger deal sizes, such as enterprise software or complex B2B services, may have lower pipeline coverage percentages compared to industries with shorter sales cycles and smaller deal sizes, such as B2C e-commerce.
In general, a higher pipeline coverage percentage is better as it indicates that the sales team has more opportunities to work with and is less reliant on a small number of large deals. This can help to mitigate the risk of not hitting sales targets if one or more deals fall through.
However, having too high of a pipeline coverage percentage can also be a problem as it can lead to a lack of focus and resources on high-priority deals. It can also cause sales teams to become complacent and less effective in identifying and pursuing new opportunities.
Ultimately, the ideal pipeline coverage percentage varies based on the company's goals and the industry in which it operates. It is important for sales teams to regularly monitor their pipeline coverage and adjust their sales strategies as needed to maintain a healthy pipeline and achieve their revenue targets.
9. Win rate: the percentage of deals won versus lost.
Win rate is a sales metric that measures the percentage of deals that a sales team successfully closes out of the total number of deals they pursue. The win rate formula is:
Here's a breakdown of each element of the formula:
- Number of Deals Won: This is the total number of deals that the sales team successfully closed within a given period, such as a month, quarter, or year.
- Number of Deals Pursued: This is the total number of deals that the sales team pursued within the same period. This includes both deals that were won and deals that were lost.
- 100: This is a multiplier to convert the result into a percentage.
For example, if a sales team pursued 100 deals in a quarter and successfully closed 20 of them, the win rate would be:
Win Rate = (20 / 100) x 100 = 20%
This means that the sales team was able to successfully close 20% of the deals they pursued in the quarter.
Win rate can also be calculated using the $ value of the opportunity. Which is calculated by dividing the total value of deals won by the total value of deals pursued. For example, if a sales team won $1 million worth of deals out of $5 million worth of deals pursued, their win rate by dollar value would be 20%.
Both win rate metrics are important to track as they provide different insights into the performance of a sales team.
- Win rate by number of opportunities provides an overall picture of the effectiveness of the sales team in converting leads into customers. It can help identify areas where the sales process may be improved, such as in lead qualification or closing techniques.
- Win rate by dollar value, on the other hand, provides insight into the quality of the deals won by the sales team. It can indicate whether the sales team is pursuing high-value opportunities that are more likely to close, or if they are pursuing lower-value opportunities that may not be as profitable.
It's important to note that neither win rate metric should be used in isolation to evaluate the performance of a sales team. Other metrics, such as average deal size, sales cycle length, and lead response time, should also be taken into account to get a comprehensive understanding of sales team performance.
Sales teams can use win rate as a benchmark to track their performance over time, compare their win rates to industry averages, and identify areas for improvement. Improving win rates can be achieved through several strategies, such as improving lead qualification, providing better sales training, optimizing the sales process, or improving the product or service offering.
10. Sales activity: the amount of activity a sales team is performing, such as calls made or emails sent.
Sales activity metrics are used to measure the level of sales activity, productivity, and effectiveness of a sales team. There are several different sales activity metrics that can be tracked, including calls made, emails sent, meetings scheduled, and proposals submitted. The formulas for these metrics are as follows:
- Calls Made: The number of calls made by a sales representative during a given time period.
- Emails Sent: The number of emails sent by a sales representative during a given time period.
- Meetings Scheduled: The number of meetings scheduled by a sales representative during a given time period.
- Proposals Submitted: The number of proposals submitted by a sales representative during a given time period.
It's important to note that these metrics can be tracked for individual sales representatives or for the sales team as a whole. Tracking these metrics can help sales managers understand how much effort their sales team is putting into their sales activities and identify areas where improvements can be made. By analyzing these metrics over time, sales managers can identify trends and patterns that can be used to optimize the sales process and improve overall sales performance.
11. Customer acquisition cost (CAC): the cost of acquiring a new customer.
Customer Acquisition Cost (CAC) is a metric that measures the cost of acquiring a new customer. It is an important metric for businesses, particularly those in the subscription-based or recurring revenue models, as it helps them understand the efficiency and effectiveness of their marketing and sales efforts. The formula for calculating CAC is as follows:
Here's a breakdown of each element of the formula:
- Total Sales and Marketing Costs: This includes all costs associated with sales and marketing efforts, such as salaries, advertising, events, and software tools.
- Number of New Customers Acquired: This is the number of new customers that the company has acquired during a specific period, such as a month or a quarter.
By calculating CAC, businesses can determine how much they are spending on average to acquire a new customer. This information can then be used to evaluate the effectiveness of different marketing and sales strategies and to optimize their budgets.
For example, if a company spent $100,000 on sales and marketing efforts in a month and acquired 100 new customers, the CAC would be:
CAC = $100,000 / 100 = $1,000 per new customer
- If the CAC is higher than the average revenue generated by a new customer, it may indicate that the company is spending too much on customer acquisition and may need to revisit their marketing and sales strategies to improve efficiency. On the other hand,
- if the CAC is lower than the average revenue generated by a new customer, it may indicate that the company is not investing enough in customer acquisition and may be missing out on growth opportunities.
Overall, CAC is an important metric for businesses to track as it helps them understand the effectiveness of their sales and marketing efforts and make data-driven decisions to optimize their customer acquisition strategies.
12. Customer lifetime value (CLV): the total value a customer brings to a business over their lifetime.
Customer Lifetime Value (CLV) is a metric that measures the total value a customer will bring to a business over the course of their relationship. It takes into account the revenue a customer generates as well as the associated costs of serving that customer. The formula for calculating CLV is as follows:
Here's a breakdown of each element of the formula:
- Average Value of a Sale: This is the average amount of revenue generated by a customer per transaction. It can be calculated by dividing the total revenue generated by the number of transactions.
- Number of Repeat Transactions: This is the number of times a customer is likely to purchase from the business over the course of their relationship. This can be estimated based on historical data or industry benchmarks.
- Average Retention Time: This is the average length of time a customer is expected to remain a customer of the business. This can also be estimated based on historical data or industry benchmarks.
By calculating CLV, businesses can understand the total value a customer will bring over the course of their relationship. This information can be used to inform decisions around customer acquisition, retention, and engagement.
For example, if the CLV is high, it may be worth investing more in customer acquisition efforts to acquire similar customers. If the CLV is low, it may be worth investing in retention strategies to increase the value of existing customers.
Overall, CLV is an important metric for businesses to track as it helps them understand the long-term value of their customers and make data-driven decisions to optimize their customer relationships. It can also be used to inform pricing strategies, marketing campaigns, and overall business strategy.
13. Churn rate: the percentage of customers who stop using a product or service over a given period of time.
Churn rate is a metric that measures the rate at which customers stop doing business with a company. It is calculated by dividing the number of customers lost during a specific period by the total number of customers at the beginning of that period. The formula for calculating churn rate is as follows:
Here's a breakdown of each element of the formula:
- Number of Customers Lost: This is the number of customers who have ended their relationship with the business during a specific period, such as a month or a quarter.
- Total Number of Customers at the Beginning of the Period: This is the total number of customers the business had at the beginning of the period being measured.
Churn rate is an important metric for businesses to track as it directly impacts revenue and growth. High churn rates can lead to reduced revenue, increased customer acquisition costs, and a negative impact on the business's reputation. On the other hand, low churn rates can lead to increased customer lifetime value, lower customer acquisition costs, and a positive impact on the business's reputation.
Here are a few stats related to churn rate:
- According to a report by Recurly, the average monthly churn rate for subscription-based businesses is 5.6%.
- A study by Bain & Company found that a 5% increase in customer retention can lead to a 25-95% increase in profits.
- In the SaaS industry, a churn rate of less than 5% per month is generally considered good, while a churn rate of more than 10% per month is considered high.
Overall, churn rate is an important metric for businesses to track as it provides insight into the health of their customer relationships and helps them identify areas for improvement. By reducing churn rate, businesses can increase revenue, reduce customer acquisition costs, and improve their overall reputation.
14. Average response time: the average time it takes to respond to customer inquiries or support tickets.
Average response time is a metric that measures the average amount of time it takes for a business to respond to a customer inquiry or request. This can include response times to emails, phone calls, chat messages, and other forms of communication. The formula for calculating average response time is as follows:
Here's a breakdown of each element of the formula:
- Total Time to Respond to All Requests: This is the total amount of time it took to respond to all customer requests during a specific period, such as a day or a week.
- Total Number of Requests: This is the total number of customer requests received during the same period.
Average response time is an important metric for businesses to track as it directly impacts customer satisfaction and loyalty. A fast response time can help businesses build trust with their customers and improve their overall reputation. On the other hand, a slow response time can lead to frustrated customers, negative reviews, and a loss of business.
Here are a few stats related to average response time:
- According to a study by SuperOffice, the average response time for email inquiries from businesses is 12 hours and 10 minutes.
- A study by Harvard Business Review found that customers are willing to pay more for a product or service if they receive a fast response time to their inquiries.
- A study by Forrester Research found that 77% of customers say that valuing their time is the most important thing a business can do to provide good customer service.
Hence, average response time is an important metric for businesses to track as it helps them understand how quickly they can respond to customer inquiries and requests. By reducing response time, businesses can improve customer satisfaction, build trust with their customers, and improve their overall reputation, which pays off exponentially in long run if you can build strategy to remain consistent with upsell, cross-sell opportunities.
15. Net promoter score (NPS): a metric that measures customer satisfaction and loyalty.
Net Promoter Score (NPS) is a metric used by businesses to measure customer loyalty and satisfaction. It is based on the premise that customers can be classified into three categories: Promoters, Passives, and Detractors. The formula for calculating NPS is as follows:
Here's a breakdown of each category:
- Promoters: Customers who rate the business with a score of 9 or 10 on a scale of 0 to 10. These customers are likely to recommend the business to others and are considered loyal.
- Passives: Customers who rate the business with a score of 7 or 8. These customers are satisfied but not necessarily loyal.
- Detractors: Customers who rate the business with a score of 0 to 6. These customers are unhappy and may actively discourage others from doing business with the company.
To calculate NPS, the percentage of Promoters is subtracted from the percentage of Detractors. The resulting score can range from -100 to 100.
NPS is an important metric for businesses to track as it provides insight into customer loyalty and satisfaction. A high NPS score can indicate that customers are happy with the business and are likely to recommend it to others, while a low NPS score can indicate that improvements need to be made.
Industry standards for NPS vary by sector, but generally, a score of 50 or higher is considered excellent, while a score of 30 or lower is considered poor. Here are a few stats related to NPS:
- According to a study by Bain & Company, companies with a high NPS score tend to grow faster and be more profitable than companies with a low NPS score.
- In the retail industry, the average NPS score is 42, according to a report by Satmetrix.
- In the technology industry, the average NPS score is 34, according to a report by CustomerGauge.
Overall, NPS is an important metric for businesses to track as it provides insight into customer loyalty and satisfaction. By improving NPS, businesses can increase customer retention, reduce customer acquisition costs, and improve their overall reputation.
Here are some free and paid tools for monitoring your sales metrics:
- Google Analytics (Free): Great for monitoring website traffic, sales conversions, and user behavior.
- HubSpot Sales Hub (Free and Paid): A CRM tool that tracks deals, pipeline, and activity metrics.
- Salesforce (Paid): A CRM tool that tracks pipeline, revenue, and activity metrics.
- Pipedrive (Paid): A CRM tool that tracks pipeline, revenue, and activity metrics.
- Mixpanel (Free and Paid): Great for tracking user behavior and engagement.
- Kissmetrics (Paid): Similar to Mixpanel, but with more advanced analytics and reporting.
- Intercom (Paid): A customer communication tool that can help track customer support metrics like response time and satisfaction.
- Freshsales (Free and Paid): A CRM tool that tracks pipeline, revenue, and activity metrics.
- SalesLoft (Paid): A sales engagement platform that tracks sales activity and performance metrics.
- Close.io (Paid): A sales CRM tool that tracks pipeline, revenue, and activity metrics.
- InsightSquared (Paid): A sales analytics platform that provides advanced reporting and analytics on pipeline, revenue, and activity metrics.
- Zoho CRM (Free and Paid): A CRM tool that tracks pipeline, revenue, and activity metrics.
- Nimble (Free and Paid): A CRM tool that tracks pipeline, revenue, and activity metrics.
- Copper (Paid): A CRM tool that tracks pipeline, revenue, and activity metrics.
- Clari (Paid): A sales forecasting and analytics tool that provides insights on pipeline, revenue, and activity metrics.
STEP #5: how to use sales forecasting to plan ahead?
Sales forecasting is the process of predicting future sales performance based on historical sales data and market trends. It is a critical tool for businesses to plan ahead and make informed decisions about resource allocation, budgeting, and overall strategy. Here are some ways to use sales forecasting to plan ahead:
- Resource allocation: Sales forecasting can help businesses determine how much inventory to purchase, how many employees to hire, and how much marketing spend to allocate. By forecasting sales, businesses can avoid over- or under-investing in resources and optimize their operations.
- Budgeting: Sales forecasting can also inform budgeting decisions by providing insight into future revenue streams. Businesses can use sales forecasts to project cash flow, set revenue targets, and make informed decisions about budget allocation.
- Strategy: Sales forecasting can help businesses identify opportunities for growth and make informed strategic decisions. By understanding market trends and customer behavior, businesses can adjust their sales and marketing strategies to capitalize on emerging opportunities.
- Risk management: Sales forecasting can also help businesses identify potential risks and plan accordingly. For example, if a sales forecast predicts a decline in revenue, a business can take steps to mitigate the risk by adjusting pricing, cutting costs, or pursuing alternative revenue streams.
In order to use sales forecasting effectively, businesses should use a combination of quantitative and qualitative data.
Historical sales data, market trends, and customer behavior are all important inputs for sales forecasting models, but it is also important to consider other factors such as seasonality, economic conditions, and competitive landscape. By taking a holistic approach to sales forecasting, businesses can make more accurate predictions and plan ahead more effectively.
Following are few sales forecasting methods/models that you can use to predict future sales. Here are some of the most common:
- Time-series analysis: This method uses historical sales data to identify patterns and trends over time. By analyzing historical data, businesses can make predictions about future sales performance.
- Qualitative forecasting: This method relies on expert opinions and subjective judgments to predict future sales. Qualitative forecasting can be useful when there is limited historical data or when market conditions are rapidly changing.
- Market research: This method involves collecting data from customers, competitors, and industry experts to gain insight into market trends and customer behavior. Market research can be used to make informed predictions about future sales.
- Regression analysis: This method uses statistical techniques to identify the relationship between sales and other variables such as pricing, advertising spend, or seasonality. By analyzing the relationship between these variables, businesses can make predictions about future sales.
- Pipeline forecasting: This method involves tracking the progress of sales opportunities through the sales pipeline and predicting the likelihood of each opportunity closing. By analyzing the sales pipeline, businesses can make predictions about future sales performance.
- Artificial intelligence (AI) and machine learning: These technologies use algorithms to analyze data and make predictions about future sales. AI and machine learning can be used to identify patterns and trends in large datasets, making them useful for businesses with complex sales data.
STEP #6: How to identify sales trend
Identifying sales trends is important for businesses to make informed decisions about their sales strategies and to stay competitive. Here are some ways to identify sales trends:
- Analyze historical sales data: Analyzing historical sales data is an effective way to identify sales trends. By looking at sales data over a specific period of time, businesses can identify patterns and trends in sales performance. This information can be used to predict future sales performance and adjust sales strategies accordingly.
- Monitor market trends: Keeping an eye on market trends can help businesses identify sales trends. For example, if a particular product or service is becoming more popular in the market, businesses may see an increase in sales for that product or service. Similarly, changes in consumer behavior, such as a shift towards online shopping, can also impact sales trends.
- Conduct customer research: Conducting customer research can help businesses identify sales trends by understanding customer needs, preferences, and behaviors. For example, businesses can conduct surveys or focus groups to gain insights into customer preferences and identify areas where they can improve their sales strategy.
- Use analytics tools: Analytics tools can be used to identify sales trends by analyzing data from various sources, such as sales data, website traffic, and social media engagement. These tools can identify patterns and trends in sales performance, as well as provide insights into customer behavior.
- Monitor competitor activity: Keeping an eye on competitor activity can help businesses identify sales trends. For example, if a competitor launches a new product or service that is successful in the market, businesses may need to adjust their sales strategy to remain competitive.
By regularly monitoring and analyzing sales data, market trends, customer behavior, and competitor activity, businesses can identify sales trends and adjust their sales strategy accordingly to stay competitive and maximize sales performance.
There are different types of sales trends that businesses can observe and analyze to gain insights into their sales performance. Here are some of the most common types of sales trends and what they can tell:
- Seasonal trends: Seasonal trends are patterns in sales performance that are related to a particular season or time of year. For example, sales of winter clothing tend to increase during the winter months. By analyzing seasonal trends, businesses can adjust their sales strategy to maximize sales during peak seasons.
- Product trends: Product trends are patterns in sales performance that are related to a particular product or service. For example, if a particular product is consistently selling well, this may indicate a high demand for that product. By analyzing product trends, businesses can identify which products are driving sales and adjust their product mix accordingly.
- Regional trends: Regional trends are patterns in sales performance that are related to a particular geographic region. For example, sales of outdoor equipment may be higher in regions with a higher concentration of national parks or outdoor recreational areas. By analyzing regional trends, businesses can adjust their sales strategy to better target specific regions.
- Sales channel trends: Sales channel trends are patterns in sales performance that are related to a particular sales channel, such as online sales or in-store sales. By analyzing sales channel trends, businesses can identify which channels are driving sales and adjust their sales strategy accordingly.
- Customer trends: Customer trends are patterns in sales performance that are related to a particular customer demographic, behavior, or preference. For example, if a particular customer segment is consistently purchasing a specific product, this may indicate a high demand for that product among that customer segment. By analyzing customer trends, businesses can better target specific customer segments and adjust their sales strategy to meet customer needs.
- Competitor trends: Competitor trend refer to the patterns in sales performance or market share of a company's competitors. By analyzing competitor trends, businesses can gain insights into their position in the market and adjust their sales and marketing strategies to stay competitive. By keeping a close eye on competitor trends, businesses can stay ahead of the competition and adjust their sales and marketing strategies to stay competitive in the market.
By identifying and analyzing different types of sales trends, businesses can gain insights into their sales performance and adjust their sales strategy to maximize sales and stay competitive.
In summary, to use sales analytics to optimize your sales pipeline, you need to define your sales goals, collect relevant sales data from various sources, analyze your sales data using sales analytics tools, use sales metrics to monitor performance, use sales forecasting to plan ahead, and identify sales trends to make data-driven decisions about your sales strategy. By doing so, you can improve your sales process, increase revenue, improve customer retention, and reduce customer churn.