
Win Rate Analysis: 10 Strategies to Improve Your Win Rate
![]()
What is Win Rate Analysis?
Why Win Rate Anlysis is Important?
- Firstly, it provides valuable insights into the sales performance of a business. By measuring the win rate, a business can understand how successful they are at closing deals and how they compare to their competitors.
- Additionally, win rate analysis can help businesses identify the strengths and weaknesses of their sales process. By identifying areas for improvement, a business can adjust their strategies to improve their win rate and ultimately improve their bottom line.
How to Calculate Win Rate?
Win rate analysis can be done by either the dollar value of opportunities or the number of opportunities won. Both of these metrics provide valuable insights into the effectiveness of your sales team and the overall health of your sales pipeline.
The formula for win rate in terms of the number of opportunities is:
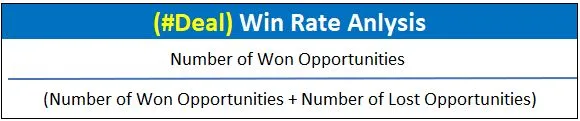
Win rate analysis by the number of opportunities won provides insights into the effectiveness of your sales team in closing a larger volume of deals.
If your win rate by the number of opportunities won is increasing over time, it can be an indication that your sales team is becoming more efficient at closing deals, which can help drive revenue growth.
The formula for win rate in terms of dollar value is:
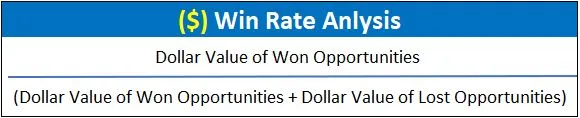
When analyzing win rate by dollar value, it provides insights into the effectiveness of your sales team in closing high-value deals.
If your win rate by dollar value is increasing over time, it can be an indication that your sales team is becoming more effective at closing high-value deals. This can be particularly important for businesses that rely on a small number of high-value deals to drive revenue.
Overall, both of these metrics are important for understanding the health of your sales pipeline and the effectiveness of your sales team. By analyzing win rate by both dollar value and the number of opportunities won, you can gain a more comprehensive understanding of the effectiveness of your sales team and identify areas for improvement.
If your win rate $ wise is increasing but your win rate # deal wise is reducing over time, what does that mean and vice-versa?
If your win rate by dollar value is increasing over time, but your win rate by the number of opportunities won is decreasing, it could mean that your sales team is becoming more effective at closing high-value deals, but struggling to close a larger volume of deals.
This could indicate that your sales team may be focusing too much on high-value deals and not enough on closing a larger number of smaller deals.
It's important to strike a balance between closing high-value deals and maintaining a healthy volume of deals to drive revenue growth.
On the other hand,
if your win rate by dollar value is decreasing over time, but your win rate by the number of opportunities won is increasing, it could indicate that your sales team is becoming more efficient at closing a larger volume of deals, but struggling to close high-value deals.
This could mean that your sales team is not targeting the right types of opportunities or may need to improve their sales strategies for high-value deals.
In this case, it's important to evaluate your sales strategy and ensure that your team is effectively targeting high-value opportunities.
10 Strategies To Improve Your Win Rate:
👉 Understand Your Customer:
Gain a deep understanding of your customer's pain points, needs, and objectives to tailor your sales approach to their specific needs.
Qualify leads: Properly qualifying leads can help businesses prioritize which opportunities to pursue, improving the win rate by focusing on the most promising leads.
👉 Develop a Strong Value Proposition:
Clearly articulate the unique value that your product or service provides to the customer and how it solves their problems.
👉 Differentiate from Competitors:
Identify what sets you apart from your competitors and highlight these differentiators to help you stand out in a crowded market. Also Analyzing competitors can provide valuable insights into their strategies and tactics, allowing businesses to adapt their approach to gain a competitive advantage.
👉 Build Trust and Rapport:
Develop strong relationships with your customers to build trust and rapport. This can be achieved through effective communication, follow-up, and exceptional customer service. This can help improve win rate by increasing trust and loyalty
👉 Address Customer Objections:
Anticipate and address potential objections that customers may have, and provide clear and compelling responses to overcome these objections. This will improve your customer experience with your brand and will reward you in long run with potential referral as well.
👉 Optimize Your Sales Process:
Continuously review and optimize your sales process to ensure that it is streamlined, efficient, effective, reduce the sales cycle time, which ultimately improve win rate
👉 Train Your Sales Team:
Invest in training and development for your sales team to improve their skills and ensure that they have the tools and resources they need to succeed. One of the implementation you can work on is building account planning exercise, product/service training, sales training etc.
👉 Leverage Technology:
Use technology such as customer relationship management (CRM) software, sales automation tools, and data analytics to improve efficiency and gain insights into your sales process.
👉 Monitor Metrics:
Continuously monitor key sales metrics such as win rate, sales cycle length, and deal size to identify areas for improvement.
👉 Align sales and marketing:
Aligning sales and marketing can help ensure that the right messages are being communicated to the right people at the right time, ultimately leading to a higher win rate.
What Are Some Additional Benefits of Win Rate Analysis?
✅ One key benefit of analyzing win rates is that it helps identify trends over time. By tracking win rates on a quarterly or yearly basis, sales teams can see if they are making progress or if their win rates are declining. If the win rate is declining, it may be time to review and adjust the sales strategy or tactics.
✅ Another benefit of win rate analysis is that it can help sales teams identify strengths and weaknesses in their sales process. By analyzing win rates at different stages of the sales cycle, sales teams can see where they are succeeding and where they need to improve. For example, if win rates are consistently low during the negotiation stage, it may be time to re-evaluate the sales team's negotiation tactics and training.
✅ Win rate analysis can also help sales teams determine which products or services are selling well and which ones are not. By comparing win rates for different products or services, sales teams can identify which ones are most attractive to customers and which ones may need to be repositioned or discontinued.
✅ Win rate analysis can help sales teams forecast future sales and revenue. By calculating the expected win rate for each opportunity in the sales pipeline, sales teams can estimate how much revenue they can expect to generate in the coming weeks or months. This information can help sales teams better plan and allocate resources, such as sales reps and marketing budgets.
What are some Key Performance Indicators (KPIs) In Your Win Loss Analysis You Can Present To Your Leadership or Track For Your Business?
When presenting win rate analysis to leadership, it's important to provide context around the metrics and explain what they mean for the business.
For example, if your win rate has increased, you should explain what factors contributed to the increase and how it has impacted the bottom line.
Similarly, if your win rate has decreased, you should explain why and what steps are being taken to address the issue.
In addition to discussing win rate, it can also be helpful to provide insights into trends over time, such as quarterly or annual changes in win rate. This can help identify areas of improvement or potential issues before they become larger problems.
When presenting to leadership, it's important to keep the focus on the metrics that are most important to the business and to explain how changes in those metrics impact the overall health of the company. This can help ensure that the data is presented in a way that is easily digestible and meaningful to stakeholders.
Here are some Key Performance Indicators (KPI) for your Win Rate Analysis to get inspired from:
❗ Year-over-year (Y-o-Y) win rate trend: This metric shows how the win rate has changed from one year to the next, and can provide insight into the long-term performance of the sales team.
❗ Quarter-over-quarter (Q-o-Q) win rate trend: This metric shows how the win rate has changed from one quarter to the next, and can help identify any trends or changes in the market that may be affecting sales.
❗ Month-over-month (MoM) win rate trend: This metric shows how the win rate has changed from one month to the next, and can provide a more detailed look at any short-term fluctuations in sales.
❗ Compound annual growth rate (CAGR) of win rate: This metric calculates the average annual growth rate of the win rate over a specified period of time, and can help identify the overall growth trajectory of the sales team.
❗ Win rate by sales rep: This metric shows the win rate for each individual sales rep, and can help identify which reps are performing well and which ones may need additional coaching or support.
❗ Win rate by product or service: This metric shows the win rate for each product or service offered by the company, and can help identify which products or services are performing well and which ones may need additional attention or resources.
❗ Win rate by customer segment: This metric shows the win rate for each customer segment, and can help identify which segments are most profitable and where the sales team should focus their efforts.
❗ Win rate by lead source: This metric shows the win rate for leads that come from different sources, such as referrals, cold calls, or online advertising. It can help identify which lead sources are most effective and where the sales team should focus their marketing efforts.
❗ Win rate by competitor: In addition to tracking your win rate against competitors as a whole, you can also track win rates against individual competitors. This can help you identify which competitors you are consistently losing to and where you need to improve. For example, if you have a low win rate against a particular competitor, you may need to adjust your sales strategy or messaging to better differentiate your product or service from theirs.
❗ Win rate by geo/area: Analyzing win rates by geographic region or sales territory can also provide valuable insights into performance. By comparing win rates across different regions or territories, you can identify areas where you may be over or underperforming. For example, if you have a high win rate in one region and a low win rate in another, you may need to adjust your sales strategy or approach in the underperforming region. Additionally, analyzing win rates by region can help you identify areas for potential growth or expansion.
Industry Benchmark for Win Rate:
There is no one-size-fits-all benchmark for win rates in all industries. The average win rate can vary widely depending on the industry, market conditions, and other factors.
However, some studies have looked at average win rates in specific industries. For example, a study by HubSpot found that the average win rate for B2B companies was around 47%. Another study by Vantage Point found that the average win rate for enterprise software companies was around 34%.
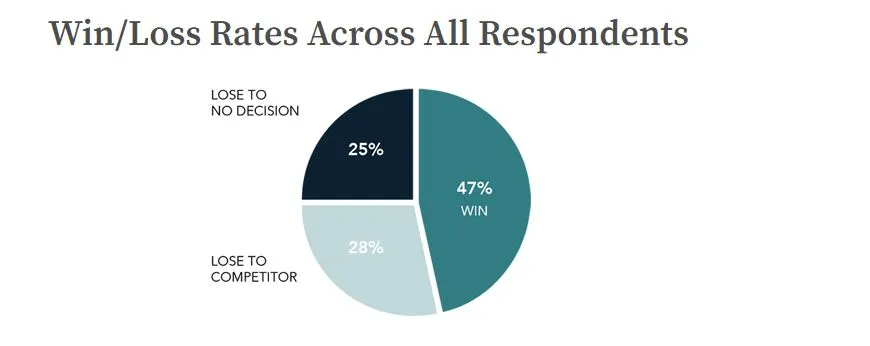
Another research from the RAIN Group Center for Sales Research surveyed 472 sellers and sales executives representing companies with salesforces ranging in size from 10 sellers to 5,000+. Among other things, we wanted to know: what is the average sales win rate, and how do win rates vary based on overall performance?
Across all respondents, the average win rate is 47%.
Difference between win rate analysis and win loss analysis and when to do what?
Win rate analysis and win-loss analysis are both important tools that sales teams can use to improve their performance and increase revenue. While both analyses involve measuring a company's success rate in closing deals, they differ in several key ways.
Win rate analysis is a measurement of the percentage of opportunities that are won, and it is typically used to identify trends and measure sales team performance over time.
On the other hand, win-loss analysis involves:
- Analyzing the reasons why deals are won or lost, as well as the competitive landscape, and is used to improve sales processes and win rates.
- It is a more in-depth analysis that requires collecting data from multiple sources, such as sales reps, customers, and competitors.
- Some of the key metrics that are measured in a win-loss analysis include the reasons why deals are lost, the strengths and weaknesses of the company's sales process, and the competitive landscape.
So, when should sales teams use win rate analysis versus win-loss analysis?
Win rate analysis is best used as a high-level metric for tracking sales team performance over time. It is a quick and easy way to see if a sales team's win rate is improving or declining.
Win-loss analysis, on the other hand, is a more detailed analysis that is used to identify specific areas for improvement in the sales process, as well as to gain insights into the competitive landscape. It is typically used when sales teams need to dive deeper into the reasons behind their win rates and identify specific areas for improvement.